If you own or work with a Google Analytics 4 property, you may have received an email recently, informing you that ‘your Google Analytics 4 properties will be upgraded to cross-channel data-driven attribution on or after 26 January 2022’.
Is this good news?
Yes, most definitely. Previously, the only way to access data-driven attribution (DDA) for Google Analytics 4 properties was with a Google Analytics 360 licence, which will set you back around £8,300 a month – for starters.
As you might expect with that kind of price tag, DDA wasn’t available for smaller accounts with lower traffic – you needed at least 600 conversions in every 30-day period to access this function. This data requirement has now been removed for both GA360 and standard GA users.
But what is data-driven attribution? Before we can answer that, let’s have a quick general recap on attribution, for those at the back.
What is attribution?
In the world of digital marketing, attribution is a form of marketing data analysis, focused on the marketing interactions or ‘touchpoints’ a customer encounters on their path to purchase.
These touchpoints are defined as any communication between a brand and an individual (customer or non-customer). A Facebook ad, a blog article, a sponsorship tag, an email, a brochure, the company website – these are all touchpoints.
Marketers are very interested to know how these touchpoints affect individuals. When a sale occurs, marketers like to have as much information as possible about which touchpoints the customer has seen/interacted with on their buying journey from initial awareness through to the ‘conversion’ (digital marketing term for either a sale or a definite measurable step towards purchase, such as filling out an online enquiry form).
In the modern age, there are many channels (both on and offline) for marketers to use. It’s critical that marketers can choose the most useful channels for their brand and product – and are able to assess where to spend their advertising budget to get the best results.
They use data gained from analytics software (and other sources) to decide which touchpoints are most responsible for the eventual sale, and how much credit each one should be attributed.
There are several different types of attribution models that can be used. As the field of web analytics has matured, so have the attribution models used to interpret the data gathered.
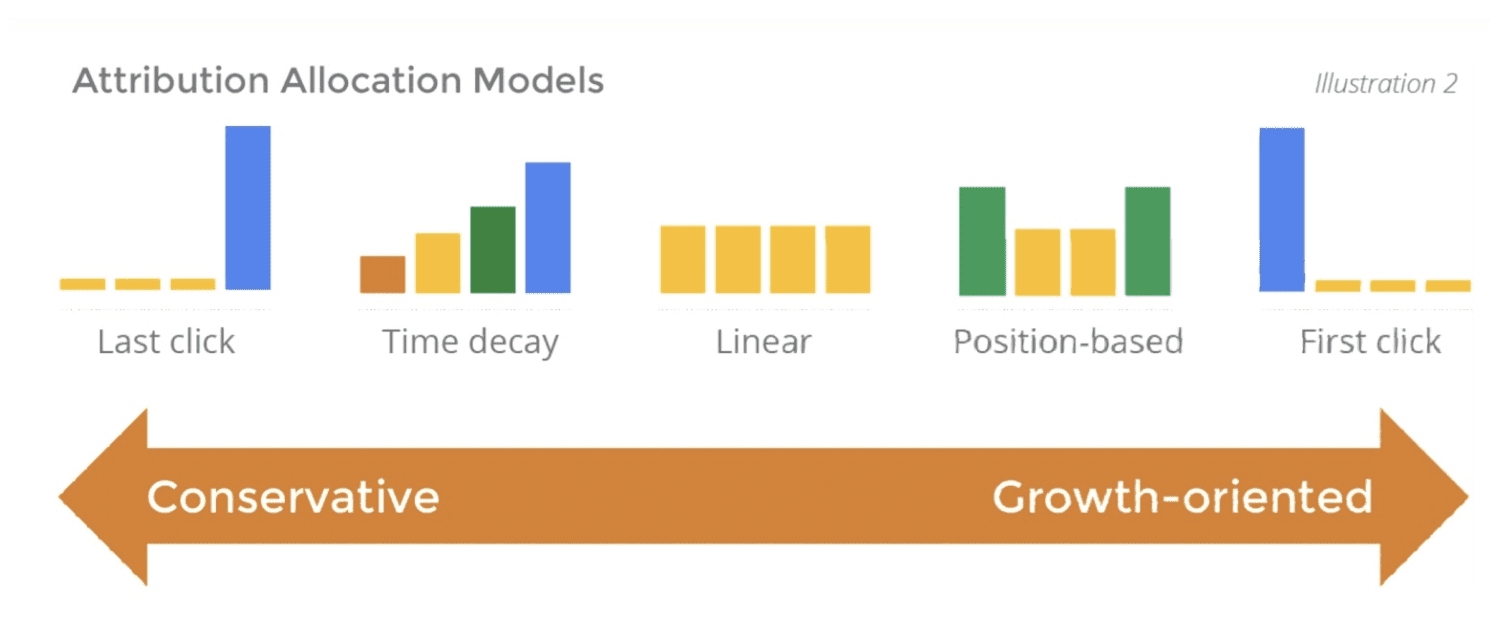
As soon as analytics software was capable of tracking multiple touchpoints, different models were developed based on different formulas, moving away from the initial single-click attribution models. There was the linear attribution model (tracking each touchpoint in order, attributing equal value to each), time-decay attribution model (tracking the length of time between each touchpoint and the conversion, attributing most value to the most recent touchpoint), and the u-shaped or position-based attribution model (attributing 40% of the credit to both the first and last touchpoints).

All these attribution models are still relevant, and useful – particularly when viewed as separate tools amongst an arsenal of methods and strategies available to the modern marketer. However, it’s important to recognise the advance that DDA represents.
Data-driven attribution
DDA uses machine learning algorithms to create a flexible, customised attribution model based on the typical buying journey of your customers. Previous models have tended to draw only on the data associated with completed buying journeys – however, DDA takes all interactions into account, with or without a conversion attached – this larger data set provides a much more detailed picture of the interactions customers are having with each touchpoint.
In addition to this larger data set, DDA processes all the information used to create older multi-touch models (order of exposure to touchpoint, time from conversion) as well as other factors such as type of device used, and the different categories of content engaged with (video, or blog, etc).
DDA allows you to build a much more complete picture of the buying journey, and can be used to identify recurring patterns of customer behaviour which may fall outside the assumptions of the simpler attribution models mentioned above.
This is of particular use in B2B markets, where the buying journey can be much more complex.
For example, when the client company uses a buying group approach to company purchases, the interactions recorded for the various members of the buying group would be unlikely to fit into the buying journey as measured by any one of the previous attribution models – depending on their role in the buying group, members would interact differently with the touchpoints, creating multiple buyer journeys for the same purchase.
Call tracking and data-driven attribution
The larger data set and more sophisticated algorithmic model of DDA can be further enhanced by the addition of call tracking and conversation intelligence to the marketing data analysis.
Take the example of the B2B buying group we just used. B2B buying groups will seek to gain as much information to inform their processes as possible. If a member of the buying group makes a call to enquire further about a product, or begin a bidding or negotiation process, that caller ID can then be correlated with analytics data to create a more detailed persona of both the buying group and the individual participant in the buying group.
It’s also worth considering that in situations where the conversion is a phone call (for businesses where the financial transaction isn’t completed online), then all your phone calls are treated as successful conversions, regardless of whether the call was to place an order or to complain about a previous purchase.
This will skew the data – and if you’re using Smart Bidding functionality on Google Ads, this lack of call data could end up costing you money.
If your data-driven attribution model is missing that final piece of the marketing puzzle, get in touch with Call 360 today.


